
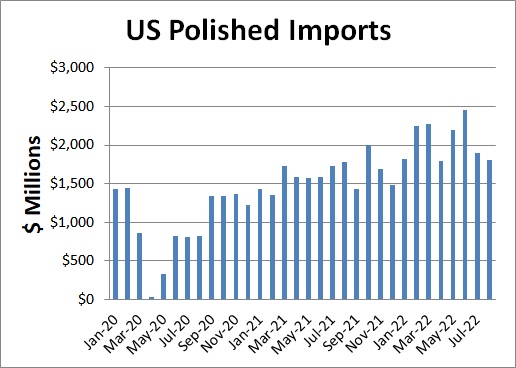
US polished-diamond imports crept up 1% year on year to $1.81 billion in August, according to recent data from the country’s Department of Commerce. The average price jumped 65%, outweighing a 39% slump in import volume.
US Trade Data for August 2022
| August 2022 | Year-on-year change | |
| Polished imports | $1.81B | 1% |
| Polished exports | $1.57B | 28% |
| Net polished imports | $233M | -58% |
| Rough imports | $11M | -66% |
| Rough exports | $38M | -38% |
| Net rough imports | -$26M | Deficit decreased 2% |
| Net diamond account | $206M | -61% |
| Polished imports: volume | 730,370 carats | -39% |
| Average price of polished imports | $2,474/carat | 65% |
| January-August 2022 | Year-on-year change | |
| Polished imports | $16.49B | 29% |
| Polished exports | $12.36B | 33% |
| Net polished imports | $4.14B | 18% |
| Rough imports | $189M | -36% |
| Rough exports | $213M | -19% |
| Net rough imports | -$24M | 2021: Surplus of $33M |
| Net diamond account | $4.11B | 17% |
| Polished imports: volume | 7.2 million carats | -5% |
| Average price of polished imports | $2,275/carat | 35% |
About the data: The US, the world’s largest diamond retail market, is a net importer of polished. As such, net polished imports — representing polished imports minus polished exports — will usually be a positive number. Net rough imports — calculated as rough imports minus rough exports — will also generally be in surplus. The nation has no operational diamond mines but has a manufacturing sector, so it normally ships more rough in than out. The net diamond account is total rough and polished imports minus total exports. It is the US’s diamond trade balance, and shows the added value the nation creates by importing — and ultimately consuming — diamonds.
Image: The New York diamond district, October 2015. (Shutterstock)